
We found recently that we were dealing with an insane number of deadlocks in our system. This was causing issues during our receiving process, and we believe it was causing issues with job closing. (We’re still researching the actual depths of what this issue affected.) The cause of the deadlocks was old data that wasn’t getting flushed out of some of our system tables. (Especially TrackRows and DefineVariables) Clearing out this data resulted in going from 5 deadlocks per hour (!) to about 2 deadlocks a day.
Firstly, an introduction to deadlocks:
SQL uses a process called locking to prevent another operation from stepping into the middle of your operation and mucking about with the data you’re trying to work with. If another operation wants to play with the data you have locked, they have to wait their turn until you’re done. This can lead to a pretty interesting conflict.
Say you have two processes and two resources; Process A, Process B, Resource 1, and Resource 2. Process A gets a lock on Resource 1, and Process B gets a lock on Resource 2. If Process A wants to get a lock on Resource 2, Process B says “Hold it, I’ve got a lock. You need to wait your turn.” Typically, this completes without incident, because Process B finishes what it was doing, Process A takes the lock on Resource 2, and when Process A is finished, everybody’s happy.
That’s not always the case, however. Because sometimes while Process A is waiting patiently for Process B to finish, Process B will make a request for Resource 1. Process A responds by saying “Hold it, I’ve got a lock. You need to wait your turn.” Now Process B is waiting on Process A to finish, while Process A is waiting on Process B to finish. SQL picks up on the fact that this is happening, and picks one of the processes as the “deadlock victim” (in other words, nukes the process from orbit) and the system continues on its merry way.
Back to our issue, once we found out we were getting deadlocks, I wanted to figure out exactly when they were happening. Now, the SQL gurus in the room will probably have a neat solution involving implementing Trace Flag 1204 and Trace Flag 1222, but I’m not nearly that smart so we’ll be using the Deadlock Graph and the SQL profiler. To get a SQL profiler trace running, we’ll need to start by opening the SQL Profiler. If you’ve never used this before (assuming it’s installed), it should be in your start menu alongside SQL Server Management Studio. (You can also get there from SSMS by going to Tools > SQL Server Profiler.
Once you’re all logged in to the SQL Server, it should pop up the New Trace wizard. From here you can give your trace a name, specify file or table output, and set a trace stop time. We’re just going to be using this for active monitoring for now, so let’s skip all that and go to the “Events Selection” tab.
From here you want to check the “Show All Events” and “Show All Columns” checkboxes. Expand the “Locks” category, and check “Deadlock Graph.” There are some other events in here that you can check if you really want them, but the Deadlock Graph should contain all of the information you need. (If you really want more information, I recommend “Lock:Deadlock” and “Lock:Deadlock Chain” which should get you some extra information on what actions led up to the deadlock.)
You may notice on enabling Deadlock Graph that it creates a third tab for “Events Extraction Settings.” That’s useful if you want to save your deadlock events to a separate file, but we’re just going to do that on the fly, so no need to do that here.
Go ahead and click Run! This screen will be boring for quite a bit, if things are functioning properly. I recommend leaving this trace open for about 24 hours, then come back to see what’s sitting there. If you don’t have any deadlocks in 24 hours, congrats! You probably don’t need to keep reading this post. If you do have some entries, let’s look at how to read them.
Here’s an image of what a deadlock graph might look like, so those of you following along at home can have some idea of what I’m talking about:
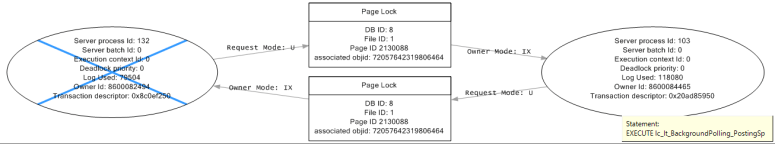
You’ll notice 2 ovals, and 2 rectangles. This appears to be what most of the deadlocks look like, but yours may be vastly different. The ovals are processes that were running, and the rectangles are the resources that were being fought over. The oval on the left has a blue X through it. That means that process was chosen as the deadlock victim.
There are a lot of numbers and letters here, so let me point out the important bits:
Server process ID: This is the process ID for that node. If your users get a “Transaction (Process ID XX) was deadlocked on lock resources with another process and has been chosen as the deadlock victim. Rerun the transaction.” message, you can use the Process ID# to find the node that got terminated.
Most of the rest of the information on the node is less than interesting, but if you hover over it it will sometimes tell you the statement that was running under that node. In our example, it’s showing that the LaborTrak(ShopTrak) background polling process got hung up on this page lock. (Sometimes it will also give you the supremely unhelpful “Proc [Database Id = 8 Object Id = 259128314].” You can get that object with
SELECT OBJECT_NAME(259128314, 8)
but I’ll show you how to extract that more easily in a moment.)
In the rectangles, you’ll see what kind of lock it is. In our example here, we have a page lock. To see the different kinds of locks, check out this link:
http://technet.microsoft.com/en-us/library/ms189849(v=sql.105).aspx
DB ID is the database that the lock happened in. Almost always, this will be your production app database. You can verify that with the following command (for DB ID = 8):
SELECT DB_NAME(8)
File ID and Page ID probably aren’t going to be too entirely useful, or at least not as useful as what I’m about to show you. AssociatedObjID is an identifier that can actually help pinpoint exactly what the resource is that’s been locked, but the code for that is a little too unwieldy for this post.
Finally, you’ll see the arrows, with the “Request Mode” and “Owner Mode.” These show you what lock mode is taking place on this resource (and who’s doing the locking.) Here’s a link that explains what all the letters mean:
http://technet.microsoft.com/en-us/library/ms175519(v=sql.105).aspx
So you have all of this information in a pretty graph, and a good portion of it is sorta useful, especially for getting a birds eye view of what got locked and what got nuked. But there’s a lot more information locked away there. Once you have a deadlock you want to analyze, find the row up above the deadlock graph, right-click and select “Extract Event Data.” This will prompt you to create a .xdl file somewhere. If you open that xdl file directly, it will open the graph in SSMS, with the same level of functionality you have in SQL Server Profiler. (e.g. you can move nodes around, get tooltip info on nodes, and agonize over the incredible amount of useless information.) However, if you open the xdl file in something other than SSMS (Notepad) you can actually see all of the xml information. And boy, is it interesting.
Here’s a sample XML output:
<deadlock-list>
<deadlock victim="process5334c8">
<process-list>
<process id="process5334c8" taskpriority="0" logused="27772" waitresource="PAGE: 8:1:2130088" waittime="617" ownerId="8680148228" transactionguid="0x0a4c0ea95838174fa67da802206dbed3" transactionname="user_transaction" lasttranstarted="2014-04-02T13:32:15.443" XDES="0x208271950" lockMode="U" schedulerid="6" kpid="5060" status="suspended" spid="103" sbid="0" ecid="0" priority="0" trancount="2" lastbatchstarted="2014-04-02T13:32:15.470" lastbatchcompleted="2014-04-02T13:32:15.460" clientapp="Mongoose" hostname="LSCERPA" hostpid="1620" loginname="sa" isolationlevel="read committed (2)" xactid="8680148228" currentdb="8" lockTimeout="4294967295" clientoption1="673384544" clientoption2="128056">
<executionStack>
<frame procname="LSC_APP.dbo.jobIup" line="2382" stmtstart="189834" stmtend="189932" sqlhandle="0x03000800e037ae130bec1601caa200000000000000000000">
delete TrackRows where SessionId = @Partition </frame>
<frame procname="adhoc" line="1" stmtstart="154" stmtend="440" sqlhandle="0x0200000071577b13b0cfea7bb65b919f5839f0e591f60331">
UPDATE [job] SET [qty_released] = @QtyReleased FROM [job] AS [job] WHERE [job].[RecordDate] = @RecordDate AND [job].[RowPointer] = @RowPointer </frame>
<frame procname="unknown" line="1" sqlhandle="0x000000000000000000000000000000000000000000000000">
unknown </frame>
</executionStack>
<inputbuf>
(@QtyReleased decimal(6,3),@RecordDate datetime,@RowPointer uniqueidentifier)UPDATE [job] SET [qty_released] = @QtyReleased FROM [job] AS [job] WHERE [job].[RecordDate] = @RecordDate AND [job].[RowPointer] = @RowPointer
SELECT @@ROWCOUNT </inputbuf>
</process>
<process id="process4d4e08" taskpriority="0" logused="86472" waitresource="PAGE: 8:1:2130088" waittime="406" ownerId="8680147587" transactionname="user_transaction" lasttranstarted="2014-04-02T13:32:15.063" XDES="0x8051ae80" lockMode="U" schedulerid="3" kpid="6024" status="suspended" spid="133" sbid="0" ecid="0" priority="0" trancount="2" lastbatchstarted="2014-04-02T13:32:00.347" lastbatchcompleted="2014-04-02T13:32:00.347" clientapp="SQLAgent - TSQL JobStep (Job 0xA40759F1F27A2B4089AA08284017FFB4 : Step 2)" hostname="LSCERPD" hostpid="2424" loginname="LINEMASTER\sladmin" isolationlevel="read committed (2)" xactid="8680147587" currentdb="8" lockTimeout="4294967295" clientoption1="673319008" clientoption2="128056">
<executionStack>
<frame procname="LSC_APP.dbo.ApsSyncImmediateSp" line="247" stmtstart="17086" stmtend="17178" sqlhandle="0x03000800fafb710f4e392a01699e00000100000000000000">
delete TrackRows where SessionId = @Partition </frame>
<frame procname="LSC_APP.dbo.JobtPostSp" line="334" stmtstart="23524" stmtend="23616" sqlhandle="0x03000800c77c4357ae632a01699e00000100000000000000">
exec dbo.ApsSyncImmediateSp @Infobar output </frame>
<frame procname="LSC_APP.dbo.lc_lt_BackgroundPolling_PostingSp" line="399" stmtstart="39070" stmtend="39282" sqlhandle="0x03000800b4aac44125db0b01a6a200000100000000000000">
EXECUTE @SEVERITY = JOBTPOSTSP @SESSIONID, &apos;&apos;, @L_TRANS_NUM, @L_TRANS_SEQ, @INFOBAR = @INFOBAR OUTPUT </frame>
<frame procname="adhoc" line="1" sqlhandle="0x01000800d3005d02f0da69c8000000000000000000000000">
EXECUTE lc_lt_BackgroundPolling_PostingSp </frame>
</executionStack>
<inputbuf>
EXECUTE lc_lt_BackgroundPolling_PostingSp </inputbuf>
</process>
</process-list>
<resource-list>
<pagelock fileid="1" pageid="2130088" dbid="8" objectname="LSC_APP.dbo.TrackRows" id="lock1ca421200" mode="IX" associatedObjectId="72057642319806464">
<owner-list>
<owner id="process4d4e08" mode="IX"/>
</owner-list>
<waiter-list>
<waiter id="process5334c8" mode="U" requestType="convert"/>
</waiter-list>
</pagelock>
<pagelock fileid="1" pageid="2130088" dbid="8" objectname="LSC_APP.dbo.TrackRows" id="lock1ca421200" mode="IX" associatedObjectId="72057642319806464">
<owner-list>
<owner id="process5334c8" mode="IX"/>
</owner-list>
<waiter-list>
<waiter id="process4d4e08" mode="U" requestType="convert"/>
</waiter-list>
</pagelock>
</resource-list>
</deadlock>
</deadlock-list>
There’s a lot of data here, and most of it is really ugly. There are some great little nuggets of info though, especially the information in the executionStack tags: For instance, (frame procname=LSC_APP.dbo.jobIup) not only tells you the process that was running, but it also gives you some interesting information inside on what T-SQL may have caused the issue. (delete TrackRows where SessionId = @Partition) There’s some more information on the executionStack, but let’s look a little further down the file at resourcelist.
In here, you’ll find the same information we had on the rectangle in the graph… (pagelock fileid=”1″ pageid=”2130088″ dbid=”8″…) But what’s this? It has the actual object that we were locking on! objectname=”LSC_APP.dbo.TrackRows”
Armed with this information, you should know not only what objects are doing the locking, what resources are being locked, but also the T-SQL inside those objects that are causing issues. This should help you figure out if your solution is as simple as cleaning out your system tables, or as complicated as re-writing some of your code to be a little more permissive on what it locks.
Hopefully this information will be helpful to some people! I know it caused me a headache over the span of several days. If you know of better ways of doing this, or if you’ve had issues with deadlocks in the past, please post below!

Hello
Usually when we set traces up on the production environment and during business hours, system slows down a lot and users complain. Does the parameters you set on this kind of trace you just shown slow down SQL performances?
Thanks
LikeLike
Thanks for commenting! Yes, SQL traces will typically slow down the system. However, for this trace, because we locked down the parameters to just deadlock events, we did not see a significant degradation of performance. A trace with the default settings will gather thousands of records in minutes, while this gathered about 100 records a day.
Hope that helps!
LikeLike
For those folks that run SQL 2012 this could be accomplished very easily using extended events and creating an event session for sqlserver.blocked_process_report and sqlserver.xml_deadlock_report. There are lots of scripts available on the internet to analyze the results using XEvents.
LikeLike
Awesome, thanks Tony. When I wrote this article, we were on SQL 2008. Nowadays, I do the same thing using RedGate’s SQL Monitor.
LikeLike